
Exploring colors
I looked into word embeddings for my bachelor thesis and stumbled into a great GitHub Gist by Allison Parrish titled “Understanding word vectors”. Her Gist is very educational, explaining everything from the ground up. However, the section about colors as vectors did not show the colors being discussed. Since I am a visual learner, I wanted to implement some way of plotting the colors to see them. I realized that this could be a handy tool in other circumstances, and I have extracted what I made and modified it to work without her Gists context.
Color basis
Let’s start by loading the color information from Darius Kazemi’s GitHub repository containing a JSON file with the xkcd color names and values.
import urllib.request, json

# read json data
with urllib.request.urlopen("https://raw.githubusercontent.com/dariusk/corpora/master/data/colors/xkcd.json") as url:
    color_data = json.loads(url.read().decode())
I want to make a dictionary that holds the hex, integer, and normalized integer values, so the first step is to create a function that converts hex to a tuple with RGB values.
def hex_to_int(color):
    """
    Converts hexcolor codes to tuple of integers.

    Args:
        color (str): hex color code.

    Returns:
        tuple: RGB values as integers.
    """
    color = color.lstrip("#")
    return int(color[:2], 16), int(color[2:4], 16), int(color[4:6], 16)
Now, I am ready to define the new color dictionary, which holds all the mentioned values.
# Define one dictionary with name as key
colors: dict = {}

for i in color_data["colors"]:
    temp = list(i.values())

    # hex color as value
    val_hex = temp[1]

    # int (RGB 0-255) color as value
    val_int = hex_to_int(temp[1])

    # normalized int (0-1) color as value
    val_norm = tuple([x / 255 for x in val_int])

    # combine to dict
    colors[temp[0]] = {"hex": val_hex, "int": val_int, "norm": val_norm}
Let’s see look at some results.
print("Sample of 5 colors with hex values")
names = [x[0] for x in list(colors.items())[0:5]]
values = [colors[x]["hex"] for x in names]
display(list(zip(names, values)))

print("Sample of 5 colors with int values")
names = [x[0] for x in list(colors.items())[0:5]]
values = [colors[x]["int"] for x in names]
display(list(zip(names, values)))

print("Sample of 5 colors with normalized int values")
names = [x[0] for x in list(colors.items())[0:5]]
values = [colors[x]["norm"] for x in names]
display(list(zip(names, values)))
    Sample of 5 colors with hex values

    [('cloudy blue', '#acc2d9'),
     ('dark pastel green', '#56ae57'),
     ('dust', '#b2996e'),
     ('electric lime', '#a8ff04'),
     ('fresh green', '#69d84f')]
    Sample of 5 colors with int values

    [('cloudy blue', (172, 194, 217)),
     ('dark pastel green', (86, 174, 87)),
     ('dust', (178, 153, 110)),
     ('electric lime', (168, 255, 4)),
     ('fresh green', (105, 216, 79))]
    Sample of 5 colors with normalized int values

    [('cloudy blue', (0.6745098039215687, 0.7607843137254902, 0.8509803921568627)),
     ('dark pastel green',
      (0.33725490196078434, 0.6823529411764706, 0.3411764705882353)),
     ('dust', (0.6980392156862745, 0.6, 0.43137254901960786)),
     ('electric lime', (0.6588235294117647, 1.0, 0.01568627450980392)),
     ('fresh green',
      (0.4117647058823529, 0.8470588235294118, 0.30980392156862746))]
Let’s test if we can give a color name as input and get the values back.
print("Test for the color 'red':")
display(colors["red"])
    Test for the color 'red':

    {'hex': '#e50000', 'int': (229, 0, 0), 'norm': (0.8980392156862745, 0.0, 0.0)}
Making it visible
There was already an excellent function for plotting colors in the Matplotlib documentation, so I copied it and made some small changes to better suit my needs.
import matplotlib.pyplot as plt
import matplotlib.colors as mcolors


def plot_colortable(colors, title="Colors", sort_colors=True, emptycols=0, title_size=18, text_size=14):

    cell_width = 212
    cell_height = 22
    swatch_width = 48
    margin = 12
    topmargin = 40

    # Sort colors by hue, saturation, value and name.
    if sort_colors is True:
        by_hsv = sorted((tuple(mcolors.rgb_to_hsv(mcolors.to_rgb(color))),
                         name)
                        for name, color in colors.items())
        names = [name for hsv, name in by_hsv]
    else:
        names = list(colors)

    n = len(names)
    ncols = 4 - emptycols
    nrows = n // ncols + int(n % ncols > 0)

    width = cell_width * 4 + 2 * margin
    height = cell_height * nrows + margin + topmargin
    dpi = 72

    fig, ax = plt.subplots(figsize=(width / dpi, height / dpi), dpi=dpi)
    fig.subplots_adjust(margin/width, margin/height,
                        (width-margin)/width, (height-topmargin)/height)
    ax.set_xlim(0, cell_width * 4)
    ax.set_ylim(cell_height * (nrows-0.5), -cell_height/2.)
    ax.yaxis.set_visible(False)
    ax.xaxis.set_visible(False)
    ax.set_axis_off()
    ax.set_title(title, fontsize=title_size, loc="left", pad=10)

    for i, name in enumerate(names):
        row = i % nrows
        col = i // nrows
        y = row * cell_height

        swatch_start_x = cell_width * col
        swatch_end_x = cell_width * col + swatch_width
        text_pos_x = cell_width * col + swatch_width + 7

        ax.text(text_pos_x, y, name, fontsize=text_size,
                horizontalalignment='left',
                verticalalignment='center')

        ax.hlines(y, swatch_start_x, swatch_end_x,
                  color=colors[name], linewidth=18)

    return fig
Since a predefined function is used for plotting, a function that generates the needed input is defined.
def make_selection_dict(names, color_index, val_type="hex"):
    """
    Makes a dictionary for the selected colors and their values.

    Args:
        names (list): color names
        color_index (dict): All avaliable colors.
        val_type (str, optional): value return type. Defaults to "hex".

    Returns:
        [dict]: color names and values.
    """
    value_list: list = []

    # Makes a list of color values based on the input and desired return type.
    for i in names:
        value_list.append(color_index[i][val_type])

    # Combines the names and values in a dictionary.
    return {k: v for k, v in zip(names, value_list)}
Let’s make a list of colors and test that the new function returns “hex” values.
color_selection = ["red", "green", "blue"]

display(selection := make_selection_dict(color_selection, colors, "hex"))
{'red': '#e50000', 'green': '#15b01a', 'blue': '#0343df'}
Now the time to see the actual colors is here.
plot_colortable(selection, sort_colors=False, emptycols=1);

Finding shades of a color
Allison’s Gist had some functions that enabled us to find the n closest colors to our selection based on euclidean distance. I have combined some of her functions and made alterations to them to better suit my needs.
def closest(color_index, color_val, n=10):
    """
    Defines a list of n closest colors to the input color.

    Args:
        color_index (dict): All avaliable colors.
        color_val (dict): Base color.
        n (int, optional): Number of closest colors. Defaults to 10.

    Returns:
        list: Names of closest colors.
    """
    from scipy.spatial.distance import euclidean
    closest = []
    if isinstance(color_val, dict):
        for key in sorted(color_index.keys(),
                          key=lambda x: euclidean(color_val["int"],
                                                  color_index[x]["int"]))[:n]:
            closest.append(key)
    elif isinstance(color_val, list):
        for key in sorted(
                color_index.keys(),
                key=lambda x: euclidean(color_val, color_index[x]["int"]))[:n]:
            closest.append(key)
    return closest
Let’s find the 6 closest colors to “red”.
color_selection = closest(colors, colors["red"], 6)
selection = make_selection_dict(color_selection, colors, "hex")  # <-- using hex
plot_colortable(selection, emptycols=1);

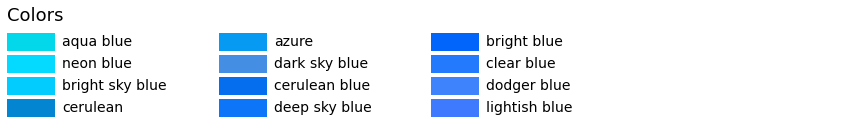
Let’s find the 6 closest colors to “green”.
color_selection = closest(colors, colors["green"], 6)
selection = make_selection_dict(color_selection, colors, "norm")  # <-- using norm
plot_colortable(selection, emptycols=1);

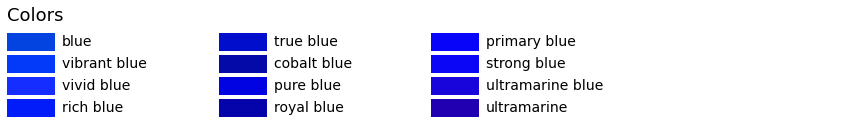
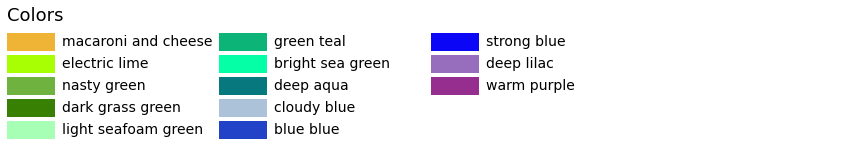
Let’s find the 12 closest colors to “pure blue”, by using the RGB values.
color_selection = closest(colors, [3, 6, 223], 12)
selection = make_selection_dict(color_selection, colors, "hex")
plot_colortable(selection, emptycols=1);
Playing with vectors
The following functions are copied as they were from the previously mentioned Gist since they do the intended job, and I don’t see any need to alter them.
Subtract one color from another
Let’s test subtracting “magenta” from “cyan”.
def subtractv(coord1, coord2):
    return [c1 - c2 for c1, c2 in zip(coord1, coord2)]

# Have to use "int" in the subtractv function
color_selection = closest(colors, subtractv(colors['magenta']["int"], colors['cyan']["int"]), 12)
selection = make_selection_dict(color_selection, colors, "hex")
plot_colortable(selection, emptycols=1);

Add one color to another
Let’s test adding “royal” with “teal”.
def addv(coord1, coord2):
    return [c1 + c2 for c1, c2 in zip(coord1, coord2)]

# Have to use "int" in the addv function
color_selection = closest(colors, addv(colors['royal']["int"], colors['teal']["int"]), 12)
selection = make_selection_dict(color_selection, colors, "hex")
plot_colortable(selection, emptycols=1);
Find the average of a list
Let’s test finding the average of black and white.
def meanv(coords):
    # assumes every item in coords has same length as item 0
    sumv = [0] * len(coords[0])
    for item in coords:
        for i in range(len(item)):
            sumv[i] += item[i]
    mean = [0] * len(sumv)
    for i in range(len(sumv)):
        mean[i] = float(sumv[i]) / len(coords)
    return mean
meanv([[0, 1], [2, 2], [4, 3]])

# Have to use "int" in the meanv function
color_selection = closest(colors, meanv([colors['black']["int"], colors['white']["int"]]), 12)
selection = make_selection_dict(color_selection, colors, "hex")
plot_colortable(selection, emptycols=1);
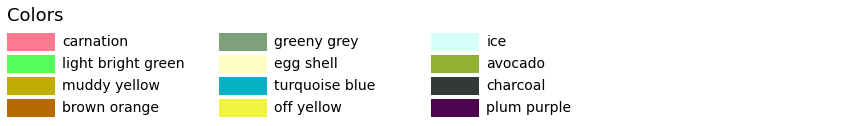
Finding random colors
import random

color_selection = random.sample(colors.keys(), 12)
selection = make_selection_dict(color_selection, colors, "hex")
plot_colortable(selection, sort_colors=False, emptycols=1);
Every n color in range
color_selection = [list(colors.keys())[x] for x in range(0, 37, 3)]
selection = make_selection_dict(color_selection, colors, "hex")
plot_colortable(selection, emptycols=1);

Leave a comment