
Active Airport
Abstract
Norway is geographically a large country compared to other European nations, especially when comparing landmass versus its in- habitants. Norway has industrial epicenters spread across the country. Many Norwegian companies often open new smaller offices to get the right people if they are unwilling to move or if there are enough people in that location to make economic sense. Moreover, a company’s location may be geographically divided when one company acquires another. Such factors have resulted in a lot of domestic airline travel. The publicly available dashboard described in this report aims to provide a visually pleasing and intuitive user experience with the tools needed to see the number of passengers for a given airport or comparing different airports depending on the type of traffic and date.
Introduction
This report describes the data gathering and its preparation for usage in the design and implementation of an exploratory dashboard aimed at giving a clear picture of the domestic airport passenger flow in Nor- way for a given location or date.
Functions
Functions stored in functions.py to make the jupyter notebook easier to work with.
def unpack_list(lst): # Oxford comma
if not isinstance(lst, str):
lst = [str(item) for item in lst]
if len(lst) == 0:
return
if len(lst) == 1:
return ", ".join(lst)
if len(lst) == 2:
return ", and ".join(lst)
else:
first_part = lst[:-1]
last_part = lst[-1]
return ", ".join(first_part) + ", and " + last_part
def word_search(df, *words):
if not words or len(words[0]) < 1:
return
col_count: int = 0
sum_words: int = 0
found_words: str = []
if isinstance(words[0], str):
words = [word for word in words]
else:
words = list(*words)
print(words)
for word in words:
col_count = 0
sum_word = 0
for column in df:
if df[column].dtype == object or df[column].dtype == str:
col_count += 1
sum_word += df[column].str.contains(f"^{word}$").sum()
if df[column].str.contains(f"^{word}$").any():
if word not in found_words:
found_words.append(word)
sum_words += sum_word
if len(found_words) == 0:
found_words = words
print("Columns of dtype str or object:", col_count)
print(
f"Instances of {unpack_list(found_words)} in the dataframe: {sum_words}"
)
def find_missing_values(df):
column_names = (df.columns[df.isnull().any() == True]).format()
miss_columns = df.isna().any().sum()
miss_values = df.isna().sum().sum()
print(f"Instances of missing data: {miss_values}")
print(f"Columns with missing data: {miss_columns}")
print(f"Column names with missing data: {unpack_list(column_names)}")
def path_checker(path):
from pathlib import Path
path = Path(path)
if path.exists():
if path.is_dir():
print(f"'{path}' is directory")
else:
if path.is_file():
print(f"'{path}' is a file")
return True
else:
print(f"'{path}' does not exist.")
return False
def df_location_data(df, search_col):
import pandas as pd
from geopy.geocoders import Nominatim
from geopy.extra.rate_limiter import RateLimiter
geolocator = Nominatim(user_agent="my_geocoder")
geocode = RateLimiter(geolocator.geocode, min_delay_seconds=.1)
# Find the location.
df['location'] = df[search_col].apply(geocode)
# Extract point to its own columns.
df['point'] = df['location'].apply(lambda loc: tuple(loc.point)
if loc else None)
# split point column into latitude, longitude and altitude columns.
df[['latitude', 'longitude',
'altitude']] = pd.DataFrame(df['point'].tolist(), index=df.index)
return df
def missing_location(df):
col_criteria = df.isnull().any(axis=0)
miss_col = df[col_criteria.index[col_criteria]]
miss_only = miss_col[miss_col.isnull().any(axis=1)]
row_criteria = df.isnull().any(axis=1)
miss_row = df[row_criteria]
return miss_col, miss_row, miss_only
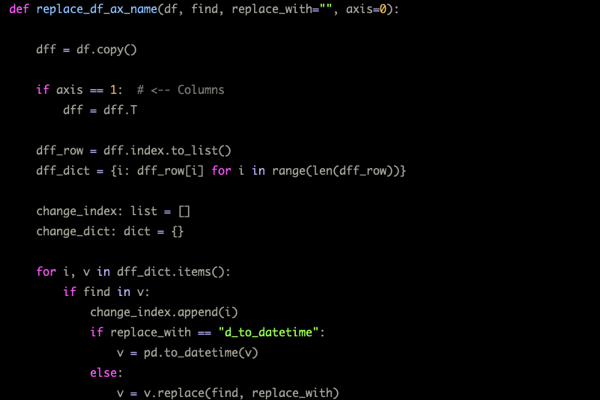
def replace_df_ax_name(df, find, replace_with="", axis=0):
import pandas as pd
dff = df.copy()
if axis == 1: # <-- Columns
dff = dff.T
dff_row = dff.index.to_list()
dff_dict = {i: dff_row[i] for i in range(len(dff_row))}
change_index: list = []
change_dict: dict = {}
for i, v in dff_dict.items():
if find in v:
change_index.append(i)
if replace_with == "d_to_datetime":
v = pd.to_datetime(v)
else:
v = v.replace(find, replace_with)
change_dict[i] = v
dff_dict.update(change_dict)
dff.index = list(dff_dict.values())
if axis == 1: # <-- Columns
dff = dff.T
return dff
Dataset Gathering & Preparation
The data used for exploration in the dashboard is gathered from the Norwegian governmental statistics agency SSB, which has the most recent and detailed data and a publicly available API. However, for simplicity, a table is created from a form-selection and downloaded as a CSV file (Sta, 2020). The categories chosen to include were passenger amount, month, year, airport name, and traffic type. However, only domestic flights and passengers on board at departure and arrival are included as per the task description. The Norwegian alphabet has three extra letters Æ, Ø, and ̊A, which all are included in the airport names. However, SSB’s CSV generator does not sup- port these characters, and they are substituted with a ”?”. Since there is no way to make a script to change these without context, each airport is manually re- named if needed. The CSV file is structured with columns for each feature ”airport”, ”type of traffic”, ”domestic/international flights”, ”passenger group”, and each date is denoted as ”Passengers yyyyMmm”. For further processing, the CSV file is imported to a Pandas DataFrame. A function for renaming either column names or index names is made and applied. The function also splits ”yyyy” from ”mm”, removes the ”M” and converts to the ”datetime” data type. The dataset is checked for missing values that could cause problems later, but none are found. For geo- graphical representation, location data is required. A function that finds the geographical point for every airport based on its name in the ”airport” column in a new column is made and applied. The dataset in its current state is called ”wide data”, and it is not well suited for making graphs. The dataset is transformed into ”long data”, where the date columns are melted into the dataset, so every row has a date. Some unnecessary columns generated by different processes are dropped, and time and day are subtracted from the dates since they are all the same due to not being available from the source. The data is now ready for use, and a process for quickly updating it is established.
# %load imports.py
# %%writefile imports.py

# https://towardsdatascience.com/how-to-effortlessly-optimize-jupyter-notebooks-e864162a06ee
import numpy as np
import pandas as pd
import plotly.graph_objects as go
import plotly.express as px
from functions import replace_df_ax_name, find_missing_values, path_checker, df_location_data, missing_location

# import matplotlib as mpl
# import matplotlib.pyplot as plt
# import seaborn as sns

# import chart_studio.plotly as py
# import cufflinks as cf

# from plotly.offline import plot, iplot, init_notebook_mode, download_plotlyjs

# init_notebook_mode(connected=True)
# cf.go_offline()
# pd.set_option("display.max_rows", 20)
# pd.set_option("display.max_columns", 20)

# small_fint_size = 14
def air_melter(df):
    df_melt = df.melt(
        id_vars=["airport", "type of traffic", "location", "point", "latitude", "longitude", "altitude"],
        var_name="date",
        value_name="passengers").sort_values(
        ["airport", "type of traffic", "location", "point", "latitude", "longitude", "altitude", "passengers"]).reset_index(drop=True)

    if "date" in df_melt:
        df_melt["date"] = pd.to_datetime(df_melt["date"])

    return df_melt
Import data
df = pd.read_csv("passenger_data.csv", delimiter=";", header=1).drop(["domestic/international flights", "passenger group"], axis=1)
df = df.sort_values(by="airport")
df.reset_index(drop=True, inplace=True)
df.head()
| airport | type of traffic | Passengers 2010M10 | Passengers 2010M11 | Passengers 2010M12 | Passengers 2011M01 | Passengers 2011M02 | Passengers 2011M03 | Passengers 2011M04 | Passengers 2011M05 | ... | Passengers 2019M12 | Passengers 2020M01 | Passengers 2020M02 | Passengers 2020M03 | Passengers 2020M04 | Passengers 2020M05 | Passengers 2020M06 | Passengers 2020M07 | Passengers 2020M08 | Passengers 2020M09 | |
|---|---|---|---|---|---|---|---|---|---|---|---|---|---|---|---|---|---|---|---|---|---|
| 0 | Alta | Non-scheduled passenger flights | 265 | 2 | 0 | 0 | 0 | 142 | 0 | 0 | ... | 0 | 0 | 0 | 0 | 4 | 134 | 330 | 328 | 336 | 54 |
| 1 | Alta | All commercial flights | 30314 | 25873 | 22914 | 23369 | 23484 | 29224 | 28631 | 32310 | ... | 24943 | 27644 | 27778 | 16487 | 4221 | 6229 | 13248 | 24120 | 20621 | 19571 |
| 2 | Alta | Freight | 0 | 0 | 0 | 0 | 0 | 0 | 0 | 0 | ... | 0 | 0 | 0 | 0 | 0 | 0 | 0 | 0 | 0 | 0 |
| 3 | Alta | Helicopter, continental shelf | 0 | 0 | 0 | 0 | 0 | 0 | 10 | 0 | ... | 0 | 0 | 0 | 0 | 0 | 16 | 49 | 27 | 0 | 0 |
| 4 | Alta | Helicopter, other | 0 | 0 | 0 | 0 | 0 | 0 | 0 | 0 | ... | 0 | 0 | 0 | 0 | 0 | 0 | 0 | 0 | 0 | 0 |
5 rows × 122 columns
Preprocessing
df = replace_df_ax_name(df, "Passengers ", "", 1)
df = replace_df_ax_name(df, "M", "-", 1)
df = replace_df_ax_name(df, "-", "d_to_datetime", 1)
df.head()
| airport | type of traffic | 2010-10-01 00:00:00 | 2010-11-01 00:00:00 | 2010-12-01 00:00:00 | 2011-01-01 00:00:00 | 2011-02-01 00:00:00 | 2011-03-01 00:00:00 | 2011-04-01 00:00:00 | 2011-05-01 00:00:00 | ... | 2019-12-01 00:00:00 | 2020-01-01 00:00:00 | 2020-02-01 00:00:00 | 2020-03-01 00:00:00 | 2020-04-01 00:00:00 | 2020-05-01 00:00:00 | 2020-06-01 00:00:00 | 2020-07-01 00:00:00 | 2020-08-01 00:00:00 | 2020-09-01 00:00:00 | |
|---|---|---|---|---|---|---|---|---|---|---|---|---|---|---|---|---|---|---|---|---|---|
| 0 | Alta | Non-scheduled passenger flights | 265 | 2 | 0 | 0 | 0 | 142 | 0 | 0 | ... | 0 | 0 | 0 | 0 | 4 | 134 | 330 | 328 | 336 | 54 |
| 1 | Alta | All commercial flights | 30314 | 25873 | 22914 | 23369 | 23484 | 29224 | 28631 | 32310 | ... | 24943 | 27644 | 27778 | 16487 | 4221 | 6229 | 13248 | 24120 | 20621 | 19571 |
| 2 | Alta | Freight | 0 | 0 | 0 | 0 | 0 | 0 | 0 | 0 | ... | 0 | 0 | 0 | 0 | 0 | 0 | 0 | 0 | 0 | 0 |
| 3 | Alta | Helicopter, continental shelf | 0 | 0 | 0 | 0 | 0 | 0 | 10 | 0 | ... | 0 | 0 | 0 | 0 | 0 | 16 | 49 | 27 | 0 | 0 |
| 4 | Alta | Helicopter, other | 0 | 0 | 0 | 0 | 0 | 0 | 0 | 0 | ... | 0 | 0 | 0 | 0 | 0 | 0 | 0 | 0 | 0 | 0 |
5 rows × 122 columns
find_missing_values(df)
Instances of missing data: 0
Columns with missing data: 0
Column names with missing data: None
Wide data
path = "df_geo.csv"
read = True

if read:
    if path_checker(path):
        df = pd.read_csv(path)
        if "date" in df:
            df["date"] = pd.to_datetime(df["date"])
else:
    if df is None:
        print("You need a DataFrame to export.")
    else:
        df_location_data(df=df, search_col="airport")
        df.to_csv(f'{path}', index=False)
'df_geo.csv' is a file
df.head()
| airport | type of traffic | 2010-10-01 00:00:00 | 2010-11-01 00:00:00 | 2010-12-01 00:00:00 | 2011-01-01 00:00:00 | 2011-02-01 00:00:00 | 2011-03-01 00:00:00 | 2011-04-01 00:00:00 | 2011-05-01 00:00:00 | ... | 2020-05-01 00:00:00 | 2020-06-01 00:00:00 | 2020-07-01 00:00:00 | 2020-08-01 00:00:00 | 2020-09-01 00:00:00 | location | point | latitude | longitude | altitude | |
|---|---|---|---|---|---|---|---|---|---|---|---|---|---|---|---|---|---|---|---|---|---|
| 0 | Alta | Non-scheduled passenger flights | 265 | 2 | 0 | 0 | 0 | 142 | 0 | 0 | ... | 134 | 330 | 328 | 336 | 54 | Alta, Troms og Finnmark, Norge | (70.04962755, 23.08254009804839, 0.0) | 70.049628 | 23.08254 | 0.0 |
| 1 | Alta | All commercial flights | 30314 | 25873 | 22914 | 23369 | 23484 | 29224 | 28631 | 32310 | ... | 6229 | 13248 | 24120 | 20621 | 19571 | Alta, Troms og Finnmark, Norge | (70.04962755, 23.08254009804839, 0.0) | 70.049628 | 23.08254 | 0.0 |
| 2 | Alta | Freight | 0 | 0 | 0 | 0 | 0 | 0 | 0 | 0 | ... | 0 | 0 | 0 | 0 | 0 | Alta, Troms og Finnmark, Norge | (70.04962755, 23.08254009804839, 0.0) | 70.049628 | 23.08254 | 0.0 |
| 3 | Alta | Helicopter, continental shelf | 0 | 0 | 0 | 0 | 0 | 0 | 10 | 0 | ... | 16 | 49 | 27 | 0 | 0 | Alta, Troms og Finnmark, Norge | (70.04962755, 23.08254009804839, 0.0) | 70.049628 | 23.08254 | 0.0 |
| 4 | Alta | Helicopter, other | 0 | 0 | 0 | 0 | 0 | 0 | 0 | 0 | ... | 0 | 0 | 0 | 0 | 0 | Alta, Troms og Finnmark, Norge | (70.04962755, 23.08254009804839, 0.0) | 70.049628 | 23.08254 | 0.0 |
5 rows × 127 columns
find_missing_values(df)
Instances of missing data: 70
Columns with missing data: 5
Column names with missing data: location, point, latitude, longitude, and altitude
miss_col, miss_row, miss_only = missing_location(df)
miss_only
| location | point | latitude | longitude | altitude | |
|---|---|---|---|---|---|
| 147 | NaN | NaN | NaN | NaN | NaN |
| 148 | NaN | NaN | NaN | NaN | NaN |
| 149 | NaN | NaN | NaN | NaN | NaN |
| 150 | NaN | NaN | NaN | NaN | NaN |
| 151 | NaN | NaN | NaN | NaN | NaN |
| 152 | NaN | NaN | NaN | NaN | NaN |
| 153 | NaN | NaN | NaN | NaN | NaN |
| 245 | NaN | NaN | NaN | NaN | NaN |
| 246 | NaN | NaN | NaN | NaN | NaN |
| 247 | NaN | NaN | NaN | NaN | NaN |
| 248 | NaN | NaN | NaN | NaN | NaN |
| 249 | NaN | NaN | NaN | NaN | NaN |
| 250 | NaN | NaN | NaN | NaN | NaN |
| 251 | NaN | NaN | NaN | NaN | NaN |
miss_col
| location | point | latitude | longitude | altitude | |
|---|---|---|---|---|---|
| 0 | Alta, Troms og Finnmark, Norge | (70.04962755, 23.08254009804839, 0.0) | 70.049628 | 23.082540 | 0.0 |
| 1 | Alta, Troms og Finnmark, Norge | (70.04962755, 23.08254009804839, 0.0) | 70.049628 | 23.082540 | 0.0 |
| 2 | Alta, Troms og Finnmark, Norge | (70.04962755, 23.08254009804839, 0.0) | 70.049628 | 23.082540 | 0.0 |
| 3 | Alta, Troms og Finnmark, Norge | (70.04962755, 23.08254009804839, 0.0) | 70.049628 | 23.082540 | 0.0 |
| 4 | Alta, Troms og Finnmark, Norge | (70.04962755, 23.08254009804839, 0.0) | 70.049628 | 23.082540 | 0.0 |
| ... | ... | ... | ... | ... | ... |
| 359 | Ørsta/Volda lufthamn, Hovden, Torvmyrane, Hovd... | (62.17820605, 6.068381079971115, 0.0) | 62.178206 | 6.068381 | 0.0 |
| 360 | Ørsta/Volda lufthamn, Hovden, Torvmyrane, Hovd... | (62.17820605, 6.068381079971115, 0.0) | 62.178206 | 6.068381 | 0.0 |
| 361 | Ørsta/Volda lufthamn, Hovden, Torvmyrane, Hovd... | (62.17820605, 6.068381079971115, 0.0) | 62.178206 | 6.068381 | 0.0 |
| 362 | Ørsta/Volda lufthamn, Hovden, Torvmyrane, Hovd... | (62.17820605, 6.068381079971115, 0.0) | 62.178206 | 6.068381 | 0.0 |
| 363 | Ørsta/Volda lufthamn, Hovden, Torvmyrane, Hovd... | (62.17820605, 6.068381079971115, 0.0) | 62.178206 | 6.068381 | 0.0 |
364 rows × 5 columns
miss_row
| airport | type of traffic | 2010-10-01 00:00:00 | 2010-11-01 00:00:00 | 2010-12-01 00:00:00 | 2011-01-01 00:00:00 | 2011-02-01 00:00:00 | 2011-03-01 00:00:00 | 2011-04-01 00:00:00 | 2011-05-01 00:00:00 | ... | 2020-05-01 00:00:00 | 2020-06-01 00:00:00 | 2020-07-01 00:00:00 | 2020-08-01 00:00:00 | 2020-09-01 00:00:00 | location | point | latitude | longitude | altitude | |
|---|---|---|---|---|---|---|---|---|---|---|---|---|---|---|---|---|---|---|---|---|---|
| 147 | Mo i Rana Røssvold | Helicopter, continental shelf | 0 | 0 | 0 | 0 | 0 | 0 | 0 | 0 | ... | 0 | 0 | 0 | 0 | 0 | NaN | NaN | NaN | NaN | NaN |
| 148 | Mo i Rana Røssvold | Other commercial flights | 0 | 0 | 0 | 0 | 0 | 0 | 0 | 0 | ... | 0 | 0 | 0 | 0 | 0 | NaN | NaN | NaN | NaN | NaN |
| 149 | Mo i Rana Røssvold | Non-scheduled passenger flights | 0 | 0 | 0 | 8 | 0 | 0 | 0 | 0 | ... | 0 | 0 | 0 | 0 | 0 | NaN | NaN | NaN | NaN | NaN |
| 150 | Mo i Rana Røssvold | Scheduled passenger flights | 12566 | 12055 | 9297 | 9673 | 10853 | 11666 | 9710 | 12730 | ... | 0 | 4240 | 9484 | 7532 | 8357 | NaN | NaN | NaN | NaN | NaN |
| 151 | Mo i Rana Røssvold | All commercial flights | 12566 | 12055 | 9297 | 9681 | 10853 | 11666 | 9710 | 12730 | ... | 0 | 4240 | 9484 | 7532 | 8357 | NaN | NaN | NaN | NaN | NaN |
| 152 | Mo i Rana Røssvold | Helicopter, other | 0 | 0 | 0 | 0 | 0 | 0 | 0 | 0 | ... | 0 | 0 | 0 | 0 | 0 | NaN | NaN | NaN | NaN | NaN |
| 153 | Mo i Rana Røssvold | Freight | 0 | 0 | 0 | 0 | 0 | 0 | 0 | 0 | ... | 0 | 0 | 0 | 0 | 0 | NaN | NaN | NaN | NaN | NaN |
| 245 | Skien Geitryggen | Non-scheduled passenger flights | 0 | 0 | 3 | 0 | 0 | 0 | 0 | 0 | ... | 0 | 0 | 0 | 0 | 0 | NaN | NaN | NaN | NaN | NaN |
| 246 | Skien Geitryggen | Other commercial flights | 0 | 0 | 0 | 0 | 0 | 0 | 0 | 0 | ... | 0 | 0 | 0 | 0 | 0 | NaN | NaN | NaN | NaN | NaN |
| 247 | Skien Geitryggen | Helicopter, other | 0 | 0 | 0 | 0 | 0 | 0 | 0 | 0 | ... | 0 | 0 | 0 | 0 | 0 | NaN | NaN | NaN | NaN | NaN |
| 248 | Skien Geitryggen | Helicopter, continental shelf | 0 | 0 | 0 | 0 | 0 | 0 | 0 | 0 | ... | 0 | 0 | 0 | 0 | 0 | NaN | NaN | NaN | NaN | NaN |
| 249 | Skien Geitryggen | Freight | 0 | 0 | 0 | 0 | 0 | 0 | 0 | 0 | ... | 0 | 0 | 0 | 0 | 0 | NaN | NaN | NaN | NaN | NaN |
| 250 | Skien Geitryggen | Scheduled passenger flights | 5230 | 5067 | 4068 | 848 | 1309 | 3798 | 4176 | 5018 | ... | 0 | 0 | 0 | 0 | 0 | NaN | NaN | NaN | NaN | NaN |
| 251 | Skien Geitryggen | All commercial flights | 5230 | 5067 | 4071 | 848 | 1309 | 3798 | 4176 | 5018 | ... | 0 | 0 | 0 | 0 | 0 | NaN | NaN | NaN | NaN | NaN |
14 rows × 127 columns
miss_row_airport = miss_row
miss_row_airport.drop_duplicates("airport")
| airport | type of traffic | 2010-10-01 00:00:00 | 2010-11-01 00:00:00 | 2010-12-01 00:00:00 | 2011-01-01 00:00:00 | 2011-02-01 00:00:00 | 2011-03-01 00:00:00 | 2011-04-01 00:00:00 | 2011-05-01 00:00:00 | ... | 2020-05-01 00:00:00 | 2020-06-01 00:00:00 | 2020-07-01 00:00:00 | 2020-08-01 00:00:00 | 2020-09-01 00:00:00 | location | point | latitude | longitude | altitude | |
|---|---|---|---|---|---|---|---|---|---|---|---|---|---|---|---|---|---|---|---|---|---|
| 147 | Mo i Rana Røssvold | Helicopter, continental shelf | 0 | 0 | 0 | 0 | 0 | 0 | 0 | 0 | ... | 0 | 0 | 0 | 0 | 0 | NaN | NaN | NaN | NaN | NaN |
| 245 | Skien Geitryggen | Non-scheduled passenger flights | 0 | 0 | 3 | 0 | 0 | 0 | 0 | 0 | ... | 0 | 0 | 0 | 0 | 0 | NaN | NaN | NaN | NaN | NaN |
2 rows × 127 columns
path = "df_geo_manual.csv"
read = True

if read:
    if path_checker(path):
        df = pd.read_csv(path)
        if "date" in df:
            df["date"] = pd.to_datetime(df["date"])
else:
    if df is None:
        print("You need a DataFrame to export.")
    else:

        from geopy.geocoders import Nominatim
        from geopy.point import Point

        geolocator = Nominatim(user_agent="my_geocoder")
        location = geolocator.reverse

        df.loc[df["airport"] == "Mo i Rana Røssvold", "latitude"] = 66.3646621704102
        df.loc[df["airport"] == "Mo i Rana Røssvold", "longitude"] = 14.3028783798218
        df.loc[df["airport"] == "Mo i Rana Røssvold", "altitude"] = 0.0

        df.loc[df["airport"] == "Skien Geitryggen", "latitude"] = 59.18429939776701
        df.loc[df["airport"] == "Skien Geitryggen", "longitude"] = 9.569653883827625
        df.loc[df["airport"] == "Skien Geitryggen", "altitude"] = 0.0

        mask = df[(df["airport"] == ("Mo i Rana Røssvold"))
                  | (df["airport"] == ("Skien Geitryggen"))]

        df.loc[mask.index, "point"] = [
            ', '.join(str(x) for x in y)
            for y in map(tuple, df.loc[mask.index, ["latitude", "longitude"]].values)
        ]

        df.loc[mask.index, "location"] = df.loc[mask.index, "point"].apply(location)

        df["location"] = df["location"].apply(str)

        # df = df.drop(['location', "altitude"], axis=1)

        df.to_csv(f'{path}', index=False)
'df_geo_manual.csv' is a file
# df[(df["airport"] == ("Mo i Rana Røssvold")) | (df["airport"] == ("Skien Geitryggen"))]
find_missing_values(df)
Instances of missing data: 0
Columns with missing data: 0
Column names with missing data: None
Long data
path = "df_melt.csv"
read = True

if read:
    if path_checker(path):
        df_melt = pd.read_csv(path)
        if "date" in df_melt:
            df_melt["date"] = pd.to_datetime(df_melt["date"])
else:
    if df is None:
        print("You need a DataFrame to export.")
    else:
        df_melt = df.melt(id_vars=[
            "airport", "type of traffic", "location", "point", "latitude", "longitude",
            "altitude"
        ],
            var_name="date",
            value_name="passengers").sort_values([
                "airport", "type of traffic", "location", "point",
                "latitude", "longitude", "altitude", "passengers"
            ]).reset_index(drop=True)
        if "date" in df_melt:
            df_melt["date"] = pd.to_datetime(df_melt["date"])

        df_melt.drop(["altitude", "point"], axis=1, inplace=True)

        #df_melt['latitude'] = df_melt['latitude'].map('{:,.2f}'.format)
        #df_melt['longitude'] = df_melt['longitude'].map('{:,.2f}'.format)

        df_melt.to_csv(f'{path}', index=False)
'df_melt.csv' is a file
df_melt['date'] = df_melt['date'].apply(lambda x: str(x)[:-9])
df_melt
| airport | type of traffic | location | latitude | longitude | date | passengers | |
|---|---|---|---|---|---|---|---|
| 0 | Alta | All commercial flights | Alta, Troms og Finnmark, Norge | 70.049628 | 23.082540 | 2020-04-01 | 4221 |
| 1 | Alta | All commercial flights | Alta, Troms og Finnmark, Norge | 70.049628 | 23.082540 | 2020-05-01 | 6229 |
| 2 | Alta | All commercial flights | Alta, Troms og Finnmark, Norge | 70.049628 | 23.082540 | 2020-06-01 | 13248 |
| 3 | Alta | All commercial flights | Alta, Troms og Finnmark, Norge | 70.049628 | 23.082540 | 2020-03-01 | 16487 |
| 4 | Alta | All commercial flights | Alta, Troms og Finnmark, Norge | 70.049628 | 23.082540 | 2020-09-01 | 19571 |
| ... | ... | ... | ... | ... | ... | ... | ... |
| 43675 | Ørsta-Volda Hovden | Scheduled passenger flights | Ørsta/Volda lufthamn, Hovden, Torvmyrane, Hovd... | 62.178206 | 6.068381 | 2012-10-01 | 11600 |
| 43676 | Ørsta-Volda Hovden | Scheduled passenger flights | Ørsta/Volda lufthamn, Hovden, Torvmyrane, Hovd... | 62.178206 | 6.068381 | 2018-10-01 | 11718 |
| 43677 | Ørsta-Volda Hovden | Scheduled passenger flights | Ørsta/Volda lufthamn, Hovden, Torvmyrane, Hovd... | 62.178206 | 6.068381 | 2013-07-01 | 11868 |
| 43678 | Ørsta-Volda Hovden | Scheduled passenger flights | Ørsta/Volda lufthamn, Hovden, Torvmyrane, Hovd... | 62.178206 | 6.068381 | 2013-10-01 | 11881 |
| 43679 | Ørsta-Volda Hovden | Scheduled passenger flights | Ørsta/Volda lufthamn, Hovden, Torvmyrane, Hovd... | 62.178206 | 6.068381 | 2014-10-01 | 12014 |
43680 rows × 7 columns
Design & Implementation
Dashboard
The dashboard’s user interaction design has a strong emphasis on being intuitive and self-explanatory. The dashboard is structured by having each graph in its own tab, thereby not giving a visual overload to the user. The controls for each graph have been made adaptive, so they automatically adjust for screen size or hide away if not applicable to the current graph. If a control group is shared, but single controls are not appropriate, they are disabled and greyed out and stated so in their labels. Labels for interaction are as short and concise as possible, only stating their function. The visual design of the dashboard and its graphs have a strong emphasis on being minimalistic to keep the focus on what the data is describing. Wherever possible, a scheme of blues, grays, and black is used for aesthetic purposes. The first impression is essential for convincing the users that the dashboard is well made. Therefore a Navbar is included with the project title and icon, and the browser pane consists of a favicon and project title. The dashboard is made by custom coding HTML, CSS, and Python in the Dash framework. The dash- board is deployed as a Flask application via Heroku. Even though it is not the simplest solution, it is needed to enable all the dashboard features.
To visit the dashboard, click here: Active Airport
Graphs
There are a lot of sources that describe how what should be considered when making a graph; the key takeaway from most of them is summarized in a tidy cheat-sheet from PolicyViz (2018). Common for all graphs is that the title is in large bold text in the upper left corner. This is considered best-practice by most professionals since it emulates the way we are taught to read, which consequently is the way we are taught to prioritize the importance of the information presented to us (Wexler, 2019). The values for each airport are provided either with text or by bubble size where applicable. Hence, none of the graphs have any grid-lines since they do not provide any additional information and would be a distraction. In addition, any relevant information for each airport is presented by hovering over each of them.
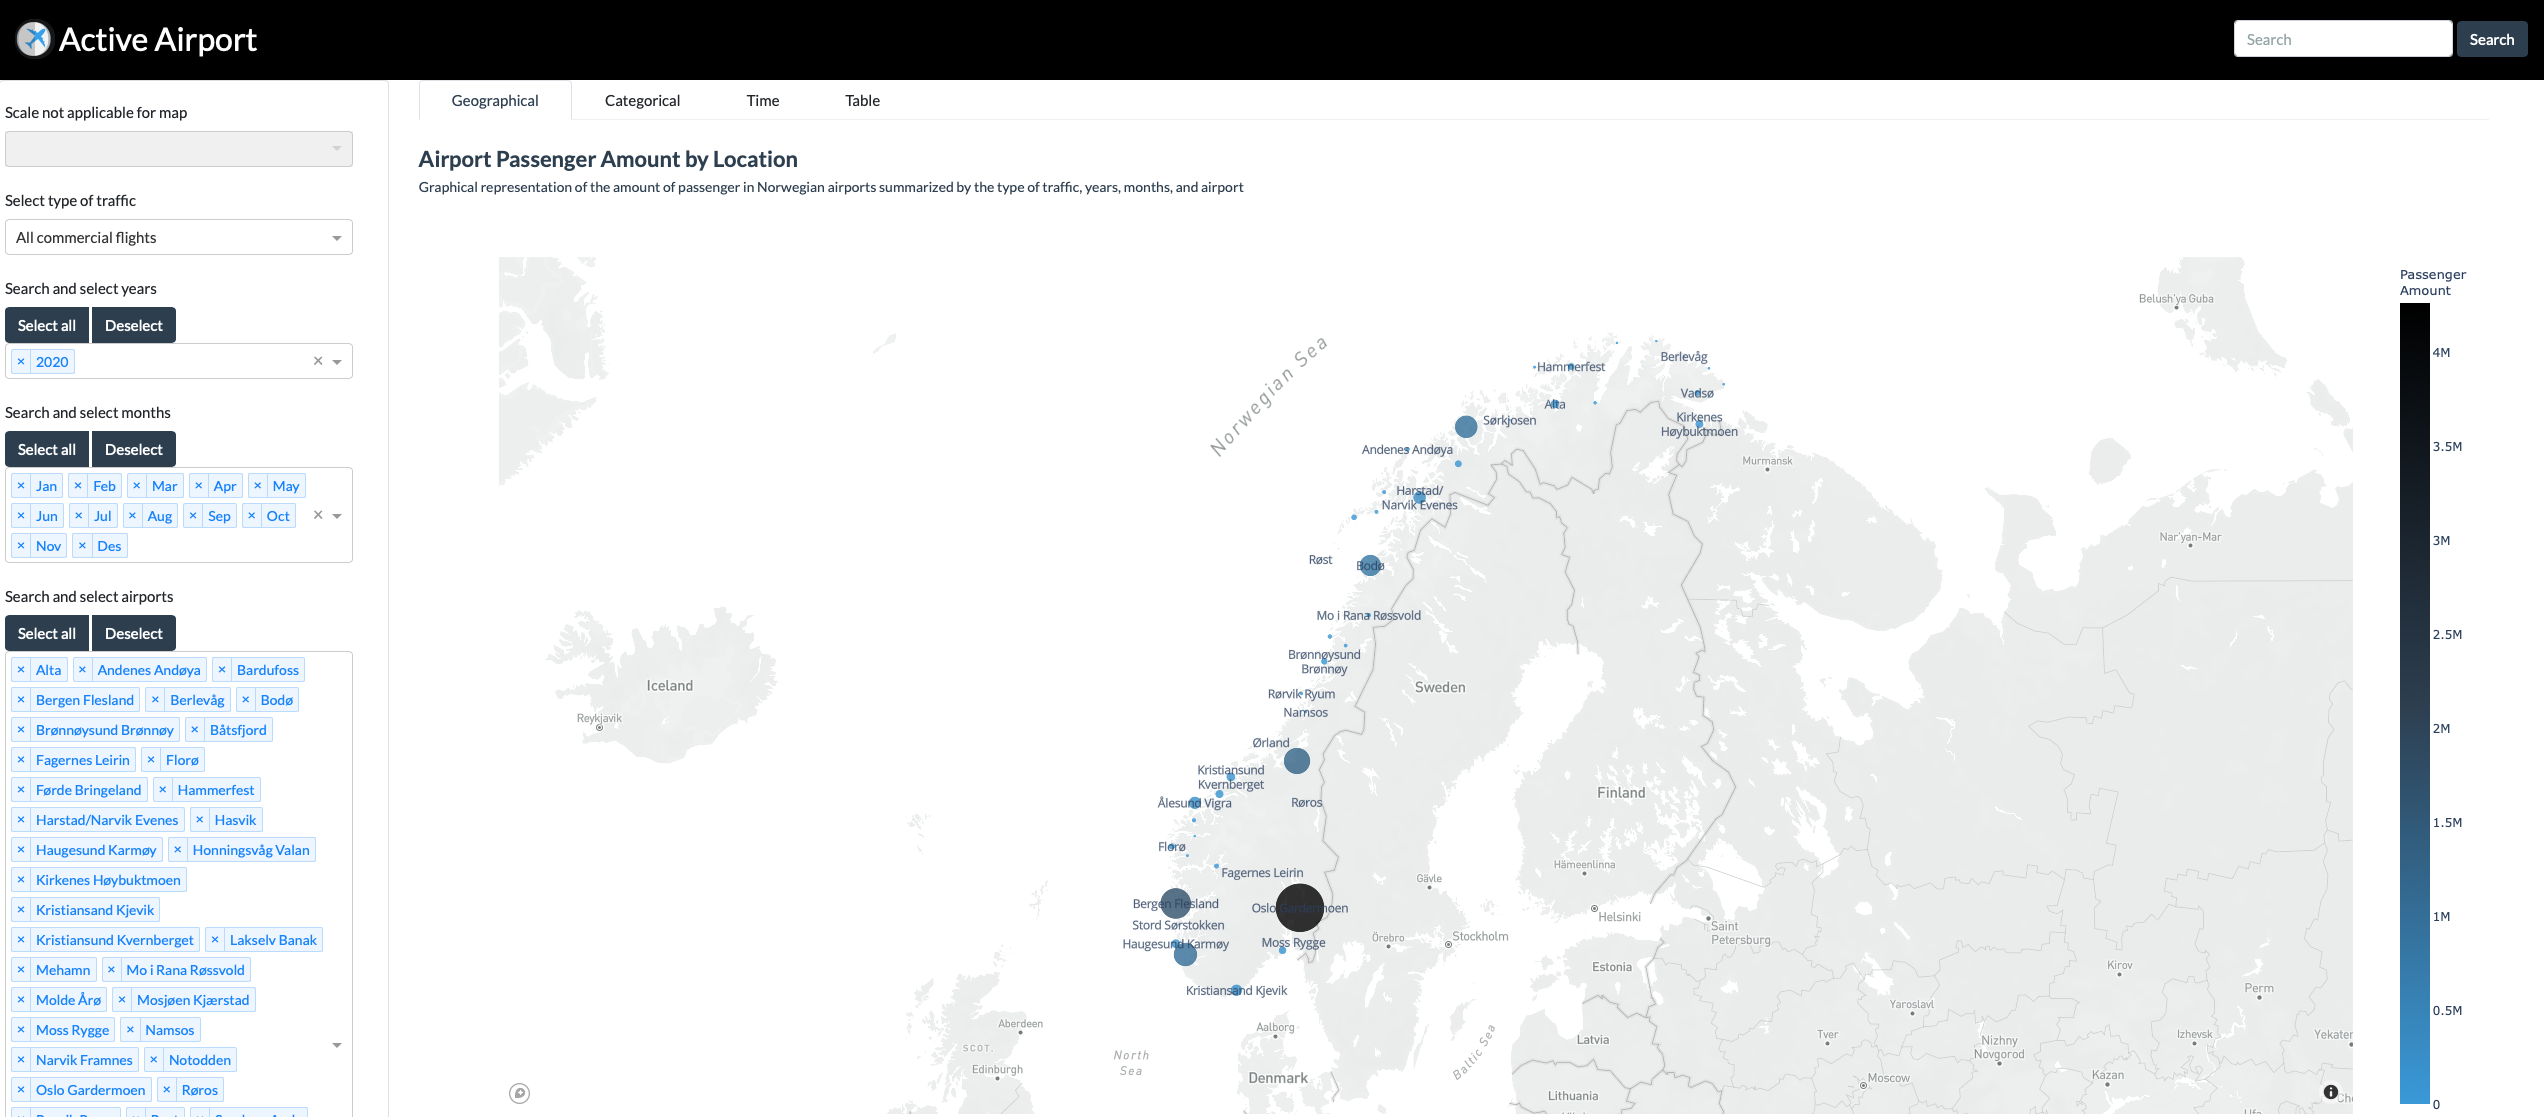
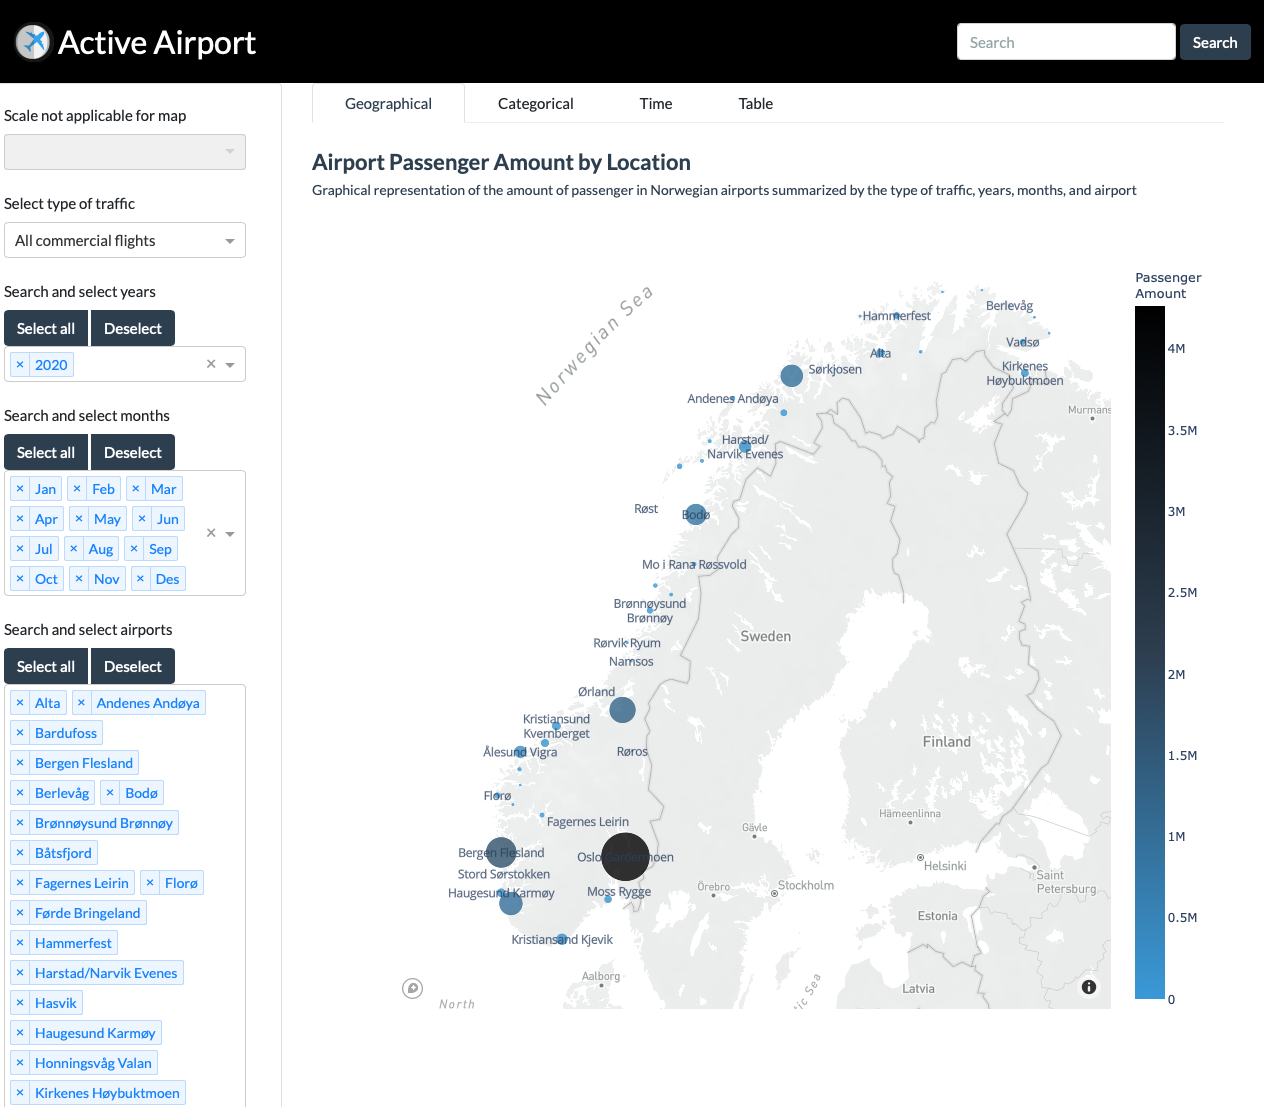
Map Graph
The map graph shown in figure 1 is made with Plotly using a custom made map provided by MapBox to have the land grey and water white, thereby keeping the focus on the data. The magnitude of passengers for an airport is represented by size and color, which like the amount denotation, will auto-adjust for the number of airports chosen and the total amount of passengers. Since there will be no visible change to the graph on a logarithmic scale, the feature is disabled. Please note a bug with the map graph not al- ways fully loading when switching to the ”Geographical” tab. Even though it should not be necessary, making the graph size update from tab change call- backs were tested but did not affect the map. How- ever, it worked for any other object. It is discovered that the ”mapboxgl-canvas-container” CSS class is the problem, which is not editable. If any control button is clicked, the map resizes.
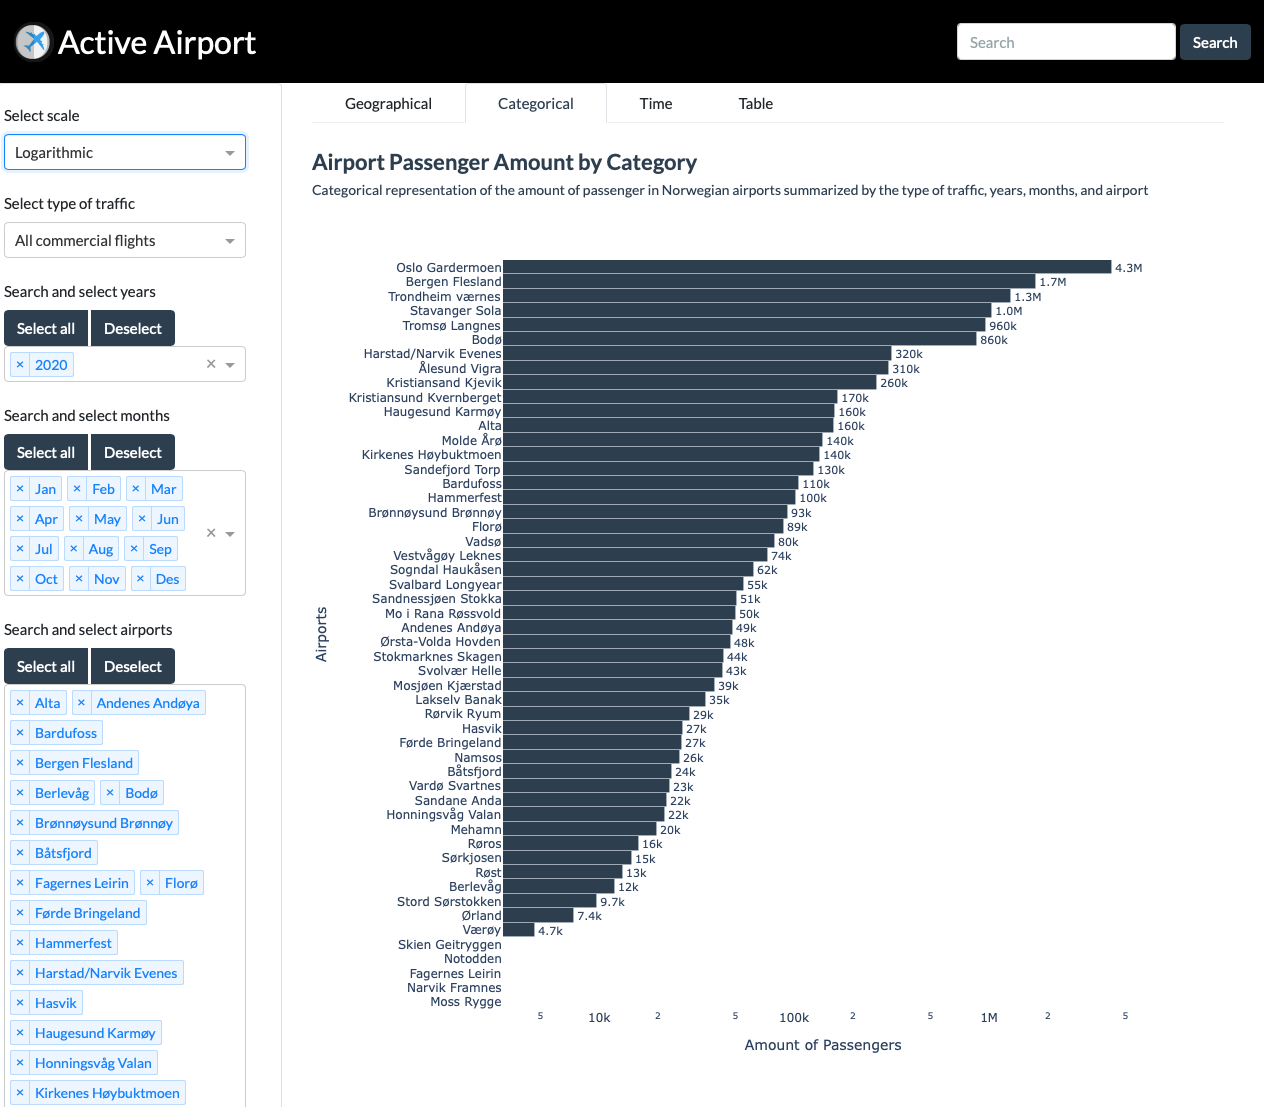
Bar Graph
The bar graph shown in figure 2 is made with Plotly and uses a copy of the data-set that is getting aggregated with app callbacks depending on the selec- tion from the controls. There are a lot of airports to choose from, so vertical bars are the best choice. The bars are sorted by the number of passengers from high to low and auto-adjusts for the number of air- ports selected, so they don’t have an awkward height. Since there is a big difference in the number of pas- sengers between the airports, a logarithmic scale can be chosen to give a better representation.
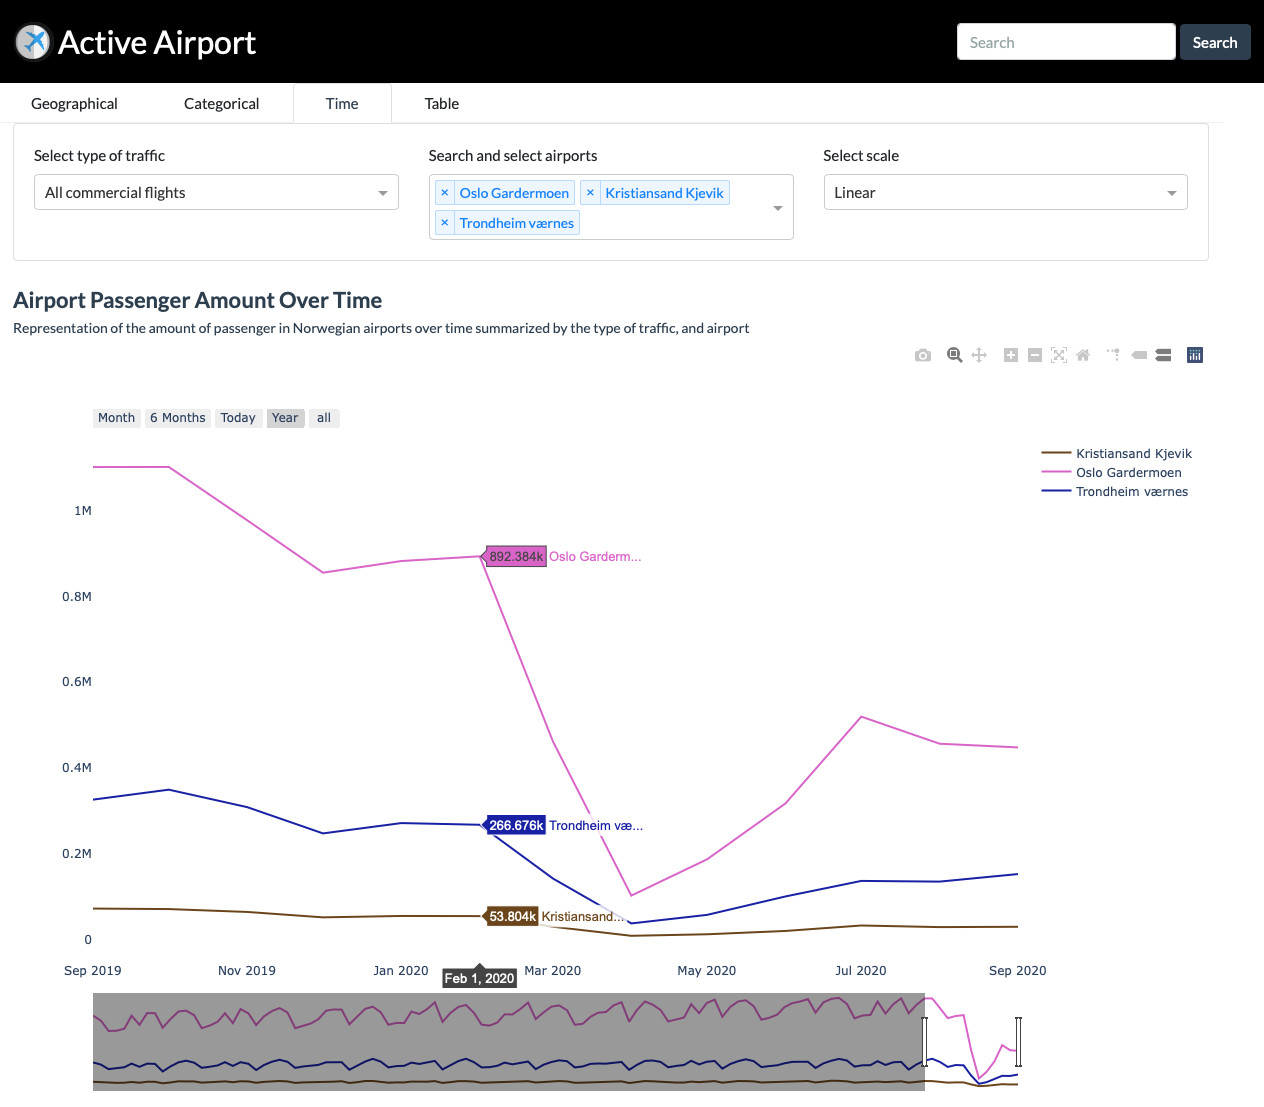
Line Graph
The line graph shown in figure 3 has no limit set to the acceptable amount of airport choice, but since it is considered bad-practice with many lines in a graph, a ”select all” button is not made to facilitate such behavior. For this reason, the line graph stands out a little in its color choice since it is the only graph that requires a legend with selected airports, and they all need to be distinct. Since the x-axis of the line graph is time, the available selections are ”type of traffic”, ”airports”, and ”Scale”. A range slider and presets for ”Month”, ”6 Months”, ”Today”, ”Year”, and ”All” are provided to help the user explore the data and discover interesting aspects, such as when Covid-19 occurred in February 2020.
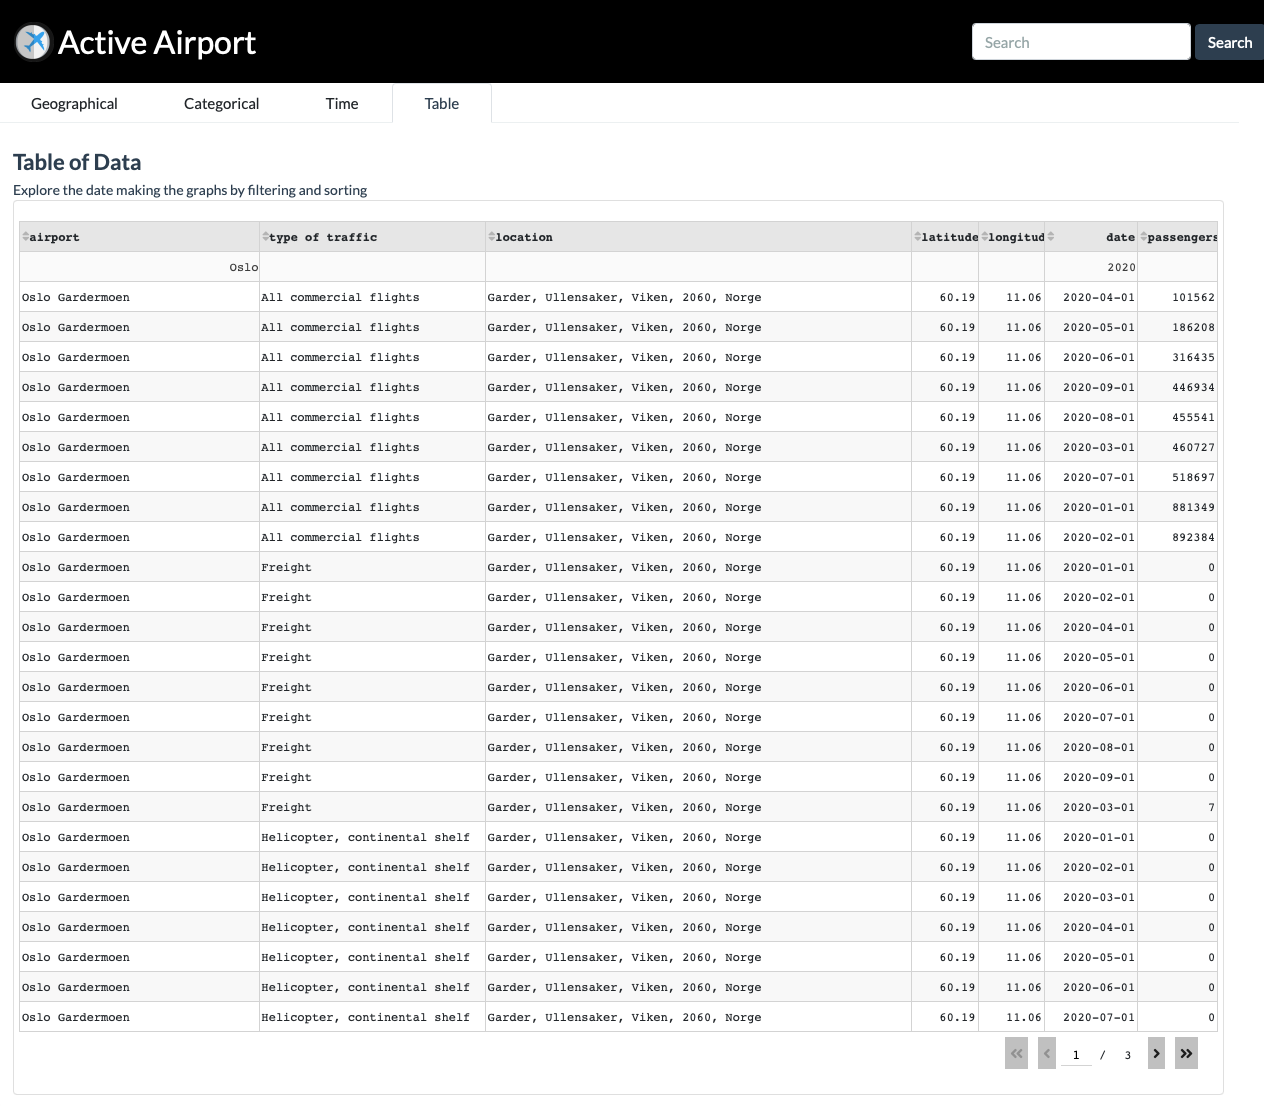
Table
A table shown in figure 4 of the data used is included to let the user see what makes up the graphs. Some of the data is not included since it is only there for function’s sake. However, the table is set up so the user can filter and sort data to find a specific row of interest.
from dash.dependencies import Input, Output
# from numpy.core.fromnumeric import size
from dash_bootstrap_components._components.Navbar import Navbar
import pandas as pd
import plotly.graph_objects as go
import plotly.express as px
import dash
import dash_table
import dash_bootstrap_components as dbc
import dash_core_components as dcc
import dash_html_components as html
from itertools import cycle
# ------------------------------------------------------------------------------
# Prepare the data / import prepared data
# ------------------------------------------------------------------------------
df_melt = pd.read_csv("df_melt.csv")
if "date" in df_melt:
df_melt["date"] = pd.to_datetime(df_melt["date"])
df_table = df_melt.copy()
df_table['latitude'] = df_table['latitude'].map('{:,.2f}'.format)
df_table['longitude'] = df_table['longitude'].map('{:,.2f}'.format)
df_table['date'] = df_table['date'].astype(str).str.strip('T00:00:00')
# df_table['date'] = df_table['date'].apply(lambda x: str(x)[:-9])
airports = df_melt["airport"].unique().tolist()
type_of_traffic = df_melt["type of traffic"].unique().tolist()
years = df_melt["date"].dt.year.unique().tolist()
years = sorted(years)
months = df_melt["date"].dt.month.unique().tolist()
months = sorted(months)
months_alpha = ["Jan", "Feb", "Mar", "Apr", "May", "Jun", "Jul", "Aug", "Sep", "Oct", "Nov", "Des"]
color_1 = "#3498db"
color_2 = "#2c3e50"
color_3 = "#000000"
# colors = ["#000000", "#080808", "#101010", "#181818", "#202020", "#282828",
# "#303030", "#383838", "#404040", "#484848", "#505050", "#585858",
# "#606060", "#686868", "#696969", "#707070", "#787878", "#808080",
# "#888888", "#909090", "#989898", "#A0A0A0", "#A8A8A8", "#A9A9A9",
# "#B0B0B0", "#B8B8B8", "#BEBEBE", "#C0C0C0", "#C8C8C8", "#D0D0D0",
# "#D3D3D3", "#D8D8D8", "#DCDCDC", "#E0E0E0", "#E8E8E8", "#F0F0F0",
# "#F5F5F5", "#F8F8F8", "#FFFFFF"]
# colors = ["#6D7B8D", "#737CA1", "#4863A0", "#2B547E", ]
palette = cycle(px.colors.qualitative.Dark24_r)
# palette = cycle(px.colors.sequential.Edge)
# ------------------------------------------------------------------------------
# Build app
# ------------------------------------------------------------------------------
mapbox_access_token = open(".mapbox_token").read()
app = dash.Dash(external_stylesheets=[dbc.themes.BOOTSTRAP])
app.title = "Active Airport"
server = app.server
# ------------------------------------------------------------------------------
# Define graphs
# ------------------------------------------------------------------------------
graph_bar = dcc.Graph(id="graph-bar", figure={}, style={"height": "80vh", "width": "100%"})
graph_map = dcc.Graph(id="graph-map", figure={}, style={"height": "80vh", "width": "100%"})
graph_line = dcc.Graph(id="graph-line", figure={}, style={"height": "75vh", "width": "100%"})
# ------------------------------------------------------------------------------
# Define search bar
# ------------------------------------------------------------------------------
search_bar = dbc.Row(
[
dbc.Col(dbc.Input(id="search-input", type="search", placeholder="Search")),
dbc.Col(
html.A(dbc.Button("Search", id="search-btn", color="primary",
className="ml-1"), href="https://upjoke.com/airport-jokes"),
width="auto",
),
],
no_gutters=True,
className="ml-auto flex-nowrap mt-3 mt-md-0",
align="center",
)
# ------------------------------------------------------------------------------
# Define Navbar
# ------------------------------------------------------------------------------
LOGO = "https://icons.iconarchive.com/icons/uiconstock/dynamic-flat-android/256/plane-icon.png"
navbar = dbc.Navbar(
[
html.A(
# Use row and col to control vertical alignment of logo / brand
dbc.Row(
[
dbc.Col(html.Img(src=LOGO, height="40px"), width="60px"),
dbc.Col(dbc.NavbarBrand("Active Airport", className="ml-1")),
],
align="center",
no_gutters=True,
),
href="http://uiconstock.com",
),
dbc.NavbarToggler(id="navbar-toggler"),
dbc.Collapse(search_bar, id="navbar-collapse", navbar=True),
],
color="black",
dark=True,
)
# ------------------------------------------------------------------------------
# Define dropdowns
# ------------------------------------------------------------------------------
traffic_dropdown = dcc.Dropdown(
id="traffic-dropdown",
options=[
{"label": t, "value": t} for t in type_of_traffic
],
value="All commercial flights",
clearable=False,
multi=False,
style={"width": "100%"},
)
year_dropdown = dcc.Dropdown(
id="year-dropdown",
options=[
{'label': y, 'value': y} for y in years
],
value=[2020],
multi=True,
style={"width": "100%"},
)
month_dropdown = dcc.Dropdown(
id="month-dropdown",
options=[
{'label': x, 'value': y} for x, y in zip(months_alpha, months)
],
value=[1, 2, 3, 4, 5, 6, 7, 8, 9, 10, 11, 12],
multi=True,
style={"width": "100%"},
)
airport_dropdown = dcc.Dropdown(
id="airport-dropdown",
options=[
{"label": a, "value": a} for a in airports
],
value=["Oslo Gardermoen", "Kristiansand Kjevik"],
clearable=False,
multi=True,
style={"width": "100%"},
)
scale_dropdown = dcc.Dropdown(
id="scale-dropdown",
options=[{"label": "Linear", "value": "Linear"},
{"label": "Logarithmic", "value": "Logarithmic"}],
value="Linear",
style={"width": "100%"},
)
################################################################################
time_traffic_dropdown = dcc.Dropdown(
id="time-traffic-dropdown",
options=[
{"label": t, "value": t} for t in type_of_traffic
],
value="All commercial flights",
clearable=False,
multi=False,
style={"width": "100%"},
)
time_airport_dropdown = dcc.Dropdown(
id="time-airport-dropdown",
options=[
{"label": a, "value": a} for a in airports
],
value=["Oslo Gardermoen", "Kristiansand Kjevik"],
clearable=False,
multi=True,
style={"width": "100%"},
)
time_scale_dropdown = dcc.Dropdown(
id="time-scale-dropdown",
options=[{"label": "Linear", "value": "Linear"},
{"label": "Logarithmic", "value": "Logarithmic"}],
value="Linear",
clearable=False,
multi=False,
style={"width": "100%"},
)
# ------------------------------------------------------------------------------
# Define buttons
# ------------------------------------------------------------------------------
year_set_btn = dbc.ButtonGroup(
[
dbc.Button(
"Select all",
id="year-btn-all",
# outline=True,
color="primary",
className="mr-1",
),
dbc.Button(
"Deselect",
id="year-btn-none",
# outline=True,
color="primary",
className="mr-1",
),
],
id="year-set-btn",
size="md",
)
month_set_btn = dbc.ButtonGroup(
[
dbc.Button(
"Select all",
id="month-btn-all",
# outline=True,
color="primary",
className="mr-1",
),
dbc.Button(
"Deselect",
id="month-btn-none",
# outline=True,
color="primary",
className="mr-1",
),
],
id="month-set-btn",
size="md",
)
airport_set_btn = dbc.ButtonGroup(
[
dbc.Button(
"Select all",
id="airport-btn-all",
# outline=True,
color="primary",
className="mr-1",
),
dbc.Button(
"Deselect",
id="airport-btn-none",
# outline=True,
color="primary",
className="mr-1",
),
],
id="airport-set-btn", size="md",
)
# ------------------------------------------------------------------------------
# Define overview options
# ------------------------------------------------------------------------------
time_options = dbc.Card(
[
dbc.Row(
[
dbc.Col([dbc.Label("Select type of traffic"), time_traffic_dropdown]),
dbc.Col([dbc.Label("Search and select airports"), time_airport_dropdown]),
dbc.Col([dbc.Label("Select scale"), time_scale_dropdown]),
]
)
], body=True
)
# ------------------------------------------------------------------------------
# Define overview options card
# ------------------------------------------------------------------------------
overview_options_card = dbc.Card(
[
dbc.Row(
[
dbc.Col(
[
dbc.Row([dbc.Label("Select scale")]),
dbc.Row([scale_dropdown]),
html.Br(),
dbc.Row([dbc.Label("Select type of traffic")]),
dbc.Row([traffic_dropdown]),
html.Br(),
dbc.Row([dbc.Label("Search and select years")]),
dbc.Row([year_set_btn]),
dbc.Row([year_dropdown]),
html.Br(),
dbc.Row([dbc.Label("Search and select months")]),
dbc.Row([month_set_btn]),
dbc.Row([month_dropdown]),
html.Br(),
dbc.Row([dbc.Label("Search and select airports")]),
dbc.Row([airport_set_btn]),
dbc.Row([airport_dropdown]),
], style={"width": "100%"},
)
], style={"width": "100%"},
),
],
body=True,
style={"width": "100%"},
)
# ------------------------------------------------------------------------------
# Define table
# ------------------------------------------------------------------------------
table = dash_table.DataTable(
id='table',
columns=[{"name": i, "id": i} for i in df_table.columns],
data=df_table.to_dict('records'),
filter_action="native",
sort_action="native",
style_cell={
'overflow': 'hidden',
'textOverflow': 'ellipsis',
'maxWidth': 0,
# 'textAlign': 'left',
},
style_cell_conditional=[
{'if': {'column_id': 'airport'},
'width': '18%', 'textAlign': 'left'},
{'if': {'column_id': 'type of traffic'},
'width': '17%', 'textAlign': 'left'},
{'if': {'column_id': 'location'},
'width': '32%', 'textAlign': 'left'},
{'if': {'column_id': 'latitude'},
'width': '5%'},
{'if': {'column_id': 'longitude'},
'width': '5%'},
{'if': {'column_id': 'date'},
'width': '7%'},
{'if': {'column_id': 'passengers'},
'width': '6%'},
],
style_data_conditional=[
{
'if': {'row_index': 'odd'},
'backgroundColor': 'rgb(248, 248, 248)'
}
],
style_header={
'backgroundColor': 'rgb(230, 230, 230)',
'fontWeight': 'bold'
},
page_size=25,
)
# ------------------------------------------------------------------------------
# Define tabs
# ------------------------------------------------------------------------------
tab1_content = dbc.Row(
[
html.Div([
html.Br(),
html.Span('Airport Passenger Amount by Location', style={
"font-size": 22, "color": color_2, 'font-weight': 'bold'}),
html.Br(),
html.Span('Graphical representation of the amount of passenger in Norwegian airports summarized by the type of traffic, years, months, and airport', style={
"font-size": 14, "color": color_2}),
]
),
graph_map,
],
no_gutters=True,
)
tab2_content = dbc.Row(
[
html.Div([
html.Br(),
html.Span('Airport Passenger Amount by Category', style={
"font-size": 22, "color": color_2, 'font-weight': 'bold'}),
html.Br(),
html.Span('Categorical representation of the amount of passenger in Norwegian airports summarized by the type of traffic, years, months, and airport', style={
"font-size": 14, "color": color_2}),
]
),
graph_bar,
],
no_gutters=True,
)
tab3_content = dbc.Col(
[
time_options,
html.Div([
html.Br(),
html.Span('Airport Passenger Amount Over Time', style={
"font-size": 22, "color": color_2, 'font-weight': 'bold'}),
html.Br(),
html.Span('Representation of the amount of passenger in Norwegian airports over time summarized by the type of traffic, and airport', style={
"font-size": 14, "color": color_2}),
]
),
graph_line,
]
)
tab4_content = dbc.Col(
[
html.Div([
html.Br(),
html.Span('Table of Data', style={
"font-size": 22, "color": color_2, 'font-weight': 'bold'}),
html.Br(),
html.Span('Explore the date making the graphs by filtering and sorting', style={
"font-size": 14, "color": color_2}),
]
),
dbc.Card(table, body=True)
]
)
tabs = dbc.Tabs(
[
dbc.Tab(tab1_content, tab_id="tab_map", label="Geographical"), # style={"width": "100%"}),
dbc.Tab(tab2_content, tab_id="tab_total", label="Categorical"), # style={"width": "100%"}),
dbc.Tab(tab3_content, tab_id="tab_time", label="Time"), # style={"width": "100%"}),
dbc.Tab(tab4_content, tab_id="tab_table", label="Table"), # style={"width": "100%"}),
],
id="tabs",
active_tab="tab_map",
style={"width": "100%"}
# style={"height": "auto", "width": "auto"},
)
# ------------------------------------------------------------------------------
# Define layout
# ------------------------------------------------------------------------------
app.layout = html.Div(
[
navbar,
dbc.Row(
[
dbc.Col(
[
dbc.Collapse(
overview_options_card,
id="menu_1",
)
], id="menu_col_1", width=6, xs=6, sm=5, md=4, lg=3, xl=2
),
dbc.Col([tabs]),
], style={"height": "auto", "width": "99%"},
)
],
# style={"height": "auto", "width": "auto"},
)
# ------------------------------------------------------------------------------
# Define callback to toggle tabs
# ------------------------------------------------------------------------------
@ app.callback(
[Output("scale-dropdown", "disabled"),
Output("menu_1", "is_open"),
Output("menu_col_1", "width"),
Output("menu_col_1", "xs"),
Output("menu_col_1", "sm"),
Output("menu_col_1", "md"),
Output("menu_col_1", "lg"),
Output("menu_col_1", "xl")],
Input("tabs", "active_tab"),
)
def toggle_tabs(id_tab):
if id_tab == "tab_time" or id_tab == "tab_table":
return False, False, "0%", 0, 0, 0, 0, 0
elif id_tab == "tab_map":
return True, True, "0%", 6, 5, 4, 3, 2
elif id_tab == "tab_total":
return False, True, "0%", 6, 5, 4, 3, 2
# ------------------------------------------------------------------------------
# Define callback to set year value
# ------------------------------------------------------------------------------
@ app.callback(Output('year-dropdown', 'value'),
[Input("year-btn-all", "n_clicks"),
Input("year-btn-none", "n_clicks")])
def set_selected_years(year_btn_all, year_btn_none):
ctx = dash.callback_context
if not ctx.triggered:
return dash.no_update
else:
button_id = ctx.triggered[0]['prop_id'].split('.')[0]
if button_id == "year-btn-all":
return [y for y in years]
if button_id == "year-btn-none":
return [2020]
# ------------------------------------------------------------------------------
# Define callback to set month value
# ------------------------------------------------------------------------------
@ app.callback(Output('month-dropdown', 'value'),
[Input("month-btn-all", "n_clicks"),
Input("month-btn-none", "n_clicks")])
def set_selected_months(month_btn_all, month_btn_none):
ctx = dash.callback_context
if not ctx.triggered:
return dash.no_update
else:
button_id = ctx.triggered[0]['prop_id'].split('.')[0]
if button_id == "month-btn-all":
return [1, 2, 3, 4, 5, 6, 7, 8, 9, 10, 11, 12]
if button_id == "month-btn-none":
return [1]
# ------------------------------------------------------------------------------
# Define callback to set airport value
# ------------------------------------------------------------------------------
@ app.callback(Output('airport-dropdown', 'value'),
[Input("airport-btn-all", "n_clicks"),
Input("airport-btn-none", "n_clicks")])
def set_selected_airports(airport_btn_all, airport_btn_none):
ctx = dash.callback_context
if not ctx.triggered:
return dash.no_update
else:
button_id = ctx.triggered[0]['prop_id'].split('.')[0]
if button_id == "airport-btn-all":
return [a for a in airports]
if button_id == "airport-btn-none":
return ["Oslo Gardermoen", "Kristiansand Kjevik"]
# ------------------------------------------------------------------------------
# Define callback to update graph
# ------------------------------------------------------------------------------
@ app.callback([Output('graph-bar', 'figure'),
Output('graph-map', 'figure')],
[Input("traffic-dropdown", "value"),
Input("year-dropdown", "value"),
Input("month-dropdown", "value"),
Input("airport-dropdown", "value"),
Input("scale-dropdown", "value")])
def update_figures(selected_traffic, selected_year, selected_month, selected_airport, selected_scale):
if not isinstance(selected_year, list):
temp: list = [selected_year]
selected_year = temp
if selected_scale == "Linear":
scale = False
else:
scale = True
if len(selected_airport) <= 5:
bargap = .65
elif 6 <= len(selected_airport) <= 10:
bargap = .25
else:
bargap = 0
# ! mapbox_style = "mapbox://styles/lewiuberg/ckhs3u53e0zed1amkxc2uvmzh"
# ! mapbox_style = "mapbox://styles/lewiuberg/ckhs6re912b8j19oz1kdk692m"
mapbox_style = "mapbox://styles/lewiuberg/cki0nrkmf3x6w19qrwb8rmgm1"
current_df = df_melt.copy()
current_df = current_df[current_df["type of traffic"] == selected_traffic]
current_df = current_df[current_df['date'].dt.year.isin(selected_year)]
current_df = current_df[current_df['date'].dt.month.isin(selected_month)]
current_df = current_df[current_df["airport"].isin(selected_airport)]
agg_current_df = current_df.groupby(
['airport'])['passengers'].agg('sum').to_frame().reset_index()
agg_current_df = agg_current_df.sort_values(by="passengers")
maplat = current_df["latitude"].unique()
maplon = current_df["longitude"].unique()
current_df_map = current_df.groupby(["airport"]).sum().copy().reset_index()
current_df_map["latitude"] = maplat
current_df_map["longitude"] = maplon
fig_bar = px.bar(agg_current_df,
x="passengers",
y="airport",
orientation="h",
log_x=scale,
# hover_name="airport",
# color="airport",
# color_continuous_scale=["blue"],
# color_discrete_map=["blue"],
color_discrete_sequence=[color_2],
)
fig_bar.update_traces(
hovertemplate='Passengers: %{x:n}')
fig_bar.update_traces(hovertemplate=None,
selector={"name": "airport"},
texttemplate='%{x:.2s}',
textposition='outside')
fig_bar.update_layout(hovermode="y",
paper_bgcolor='rgba(0,0,0,0)',
plot_bgcolor='rgba(0,0,0,0)',
uniformtext_minsize=8,
uniformtext_mode='hide',
bargap=bargap,
modebar={'bgcolor': 'rgba(255,255,255,0.0)'},
xaxis_title="Amount of Passengers",
yaxis_title="Airports",)
fig_bar.update_xaxes(showgrid=False)
fig_bar.update_yaxes(showgrid=False)
# -----------------------------------------------------------------------------
fig_map = px.scatter_mapbox(current_df_map,
lat="latitude",
lon="longitude",
size="passengers",
opacity=.8,
size_max=35,
color="passengers",
text="airport",
hover_name="airport",
color_continuous_scale=[color_1, color_2, color_3],
zoom=3.9,
center={"lat": 65, "lon": 17},
)
fig_map.update_traces(
hovertemplate='<b>%{text}</b><br><br>Passengers: %{marker.size:n} <br>Lat: %{lat:,.2f} <br>Lon: %{lon:,.2f}')
fig_map.update_traces(hovertemplate=None, selector={"name": "airport"})
fig_map.update_layout(mapbox_style=mapbox_style,
mapbox_accesstoken=mapbox_access_token,
modebar={'bgcolor': 'rgba(255,255,255,0.0)'},
coloraxis_colorbar=dict(
title='<span style="font-size: 13px;">Passenger<br>Amount</span>',
),
)
fig_map.update_xaxes(showgrid=False)
fig_map.update_yaxes(showgrid=False)
return fig_bar, fig_map
# ------------------------------------------------------------------------------
# Define callback to update graph
# ------------------------------------------------------------------------------
@ app.callback(Output('graph-line', 'figure'),
[Input("time-traffic-dropdown", "value"),
Input("time-airport-dropdown", "value"),
Input("time-scale-dropdown", "value")])
def update_figure(selected_traffic, selected_airport, selected_scale):
df_airport = df_melt.copy()
df_airport = df_melt[df_melt["type of traffic"] == selected_traffic]
df_airport = df_airport[df_airport['airport'].isin(selected_airport)]
airport_range = df_airport["airport"].unique().tolist()
n_airports: list = []
for a in airport_range:
n_airports.append(df_airport[df_airport["airport"] == a])
agg_airports: dict = {}
for a in range(len(airport_range)):
n_airports[a] = n_airports[a].groupby(['date'])['passengers'].agg('sum').to_frame().reset_index()
agg_airports[airport_range[a]] = n_airports[a].sort_values(by="date")
if selected_scale == "Linear":
scale = 'linear'
else:
scale = 'log'
fig_line = go.Figure()
for i, (k, v) in enumerate(agg_airports.items()):
fig_line.add_trace(go.Scatter(
name=k,
mode="lines", x=v["date"], y=v["passengers"],
# line=dict(color=colors[i]),
line=dict(color=next(palette)),
)
)
fig_line.update_xaxes(
rangeslider_visible=True,
rangeselector=dict(
buttons=list([
dict(count=1, label="Month", step="month", stepmode="backward"),
dict(count=6, label="6 Months", step="month", stepmode="backward"),
dict(count=1, label="Today", step="year", stepmode="todate"),
dict(count=1, label="Year", step="year", stepmode="backward"),
dict(step="all")
])
),
)
fig_line.update_layout(hovermode="x",
yaxis_type=scale,
paper_bgcolor='rgba(0,0,0,0)',
plot_bgcolor='rgba(0,0,0,0)',
modebar={'bgcolor': 'rgba(255,255,255,0.0)'},
)
fig_line.update_xaxes(showgrid=False)
fig_line.update_yaxes(showgrid=False)
return fig_line
# ------------------------------------------------------------------------------
# Run app and display the result
# ------------------------------------------------------------------------------
app.run_server(debug=True)
Conclusion
Airport data has been gathered from Statistics Norway, as well as being shaped in an appropriate manner for the selected task. Utilizing this data as its source, a dashboard has been designed, implemented, and deployed. The dashboard is made up of 4 tabs, each with a different means to interact with the data.

Leave a comment